The customer's own rhythm
Recency is divided by the customer's usual interval between visits, so a weekly shopper and a quarterly shopper trigger the alarm at different times.
12 segments, RFM, 12 reports and 60 customer metrics. The system compares the time since the last purchase with each customer's own rhythm and suggests an action.
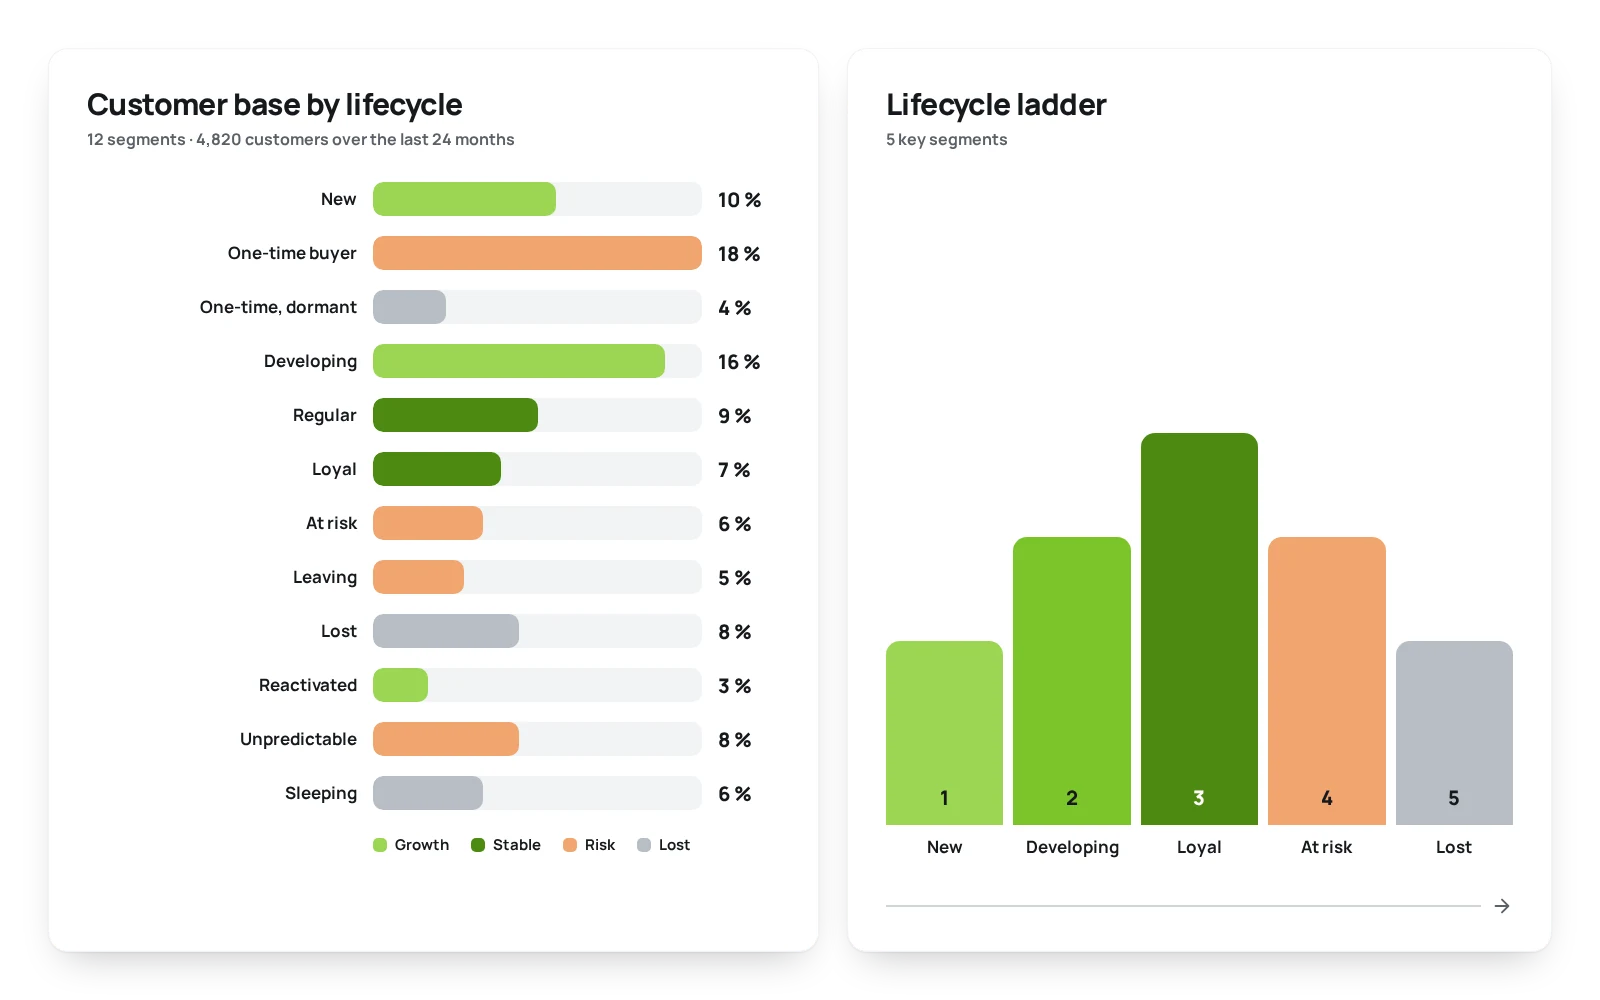
The customer lifecycle answers one question: which customers are leaving before they have left. The system sorts customers into 12 segments, calculates 60 metrics and compares the gap between purchases with the customer's own rhythm, not one threshold for everyone. The calculation runs in the ERP module.
Recency is divided by the customer's usual interval between visits, so a weekly shopper and a quarterly shopper trigger the alarm at different times.
Two receipts on one day count as one visit.
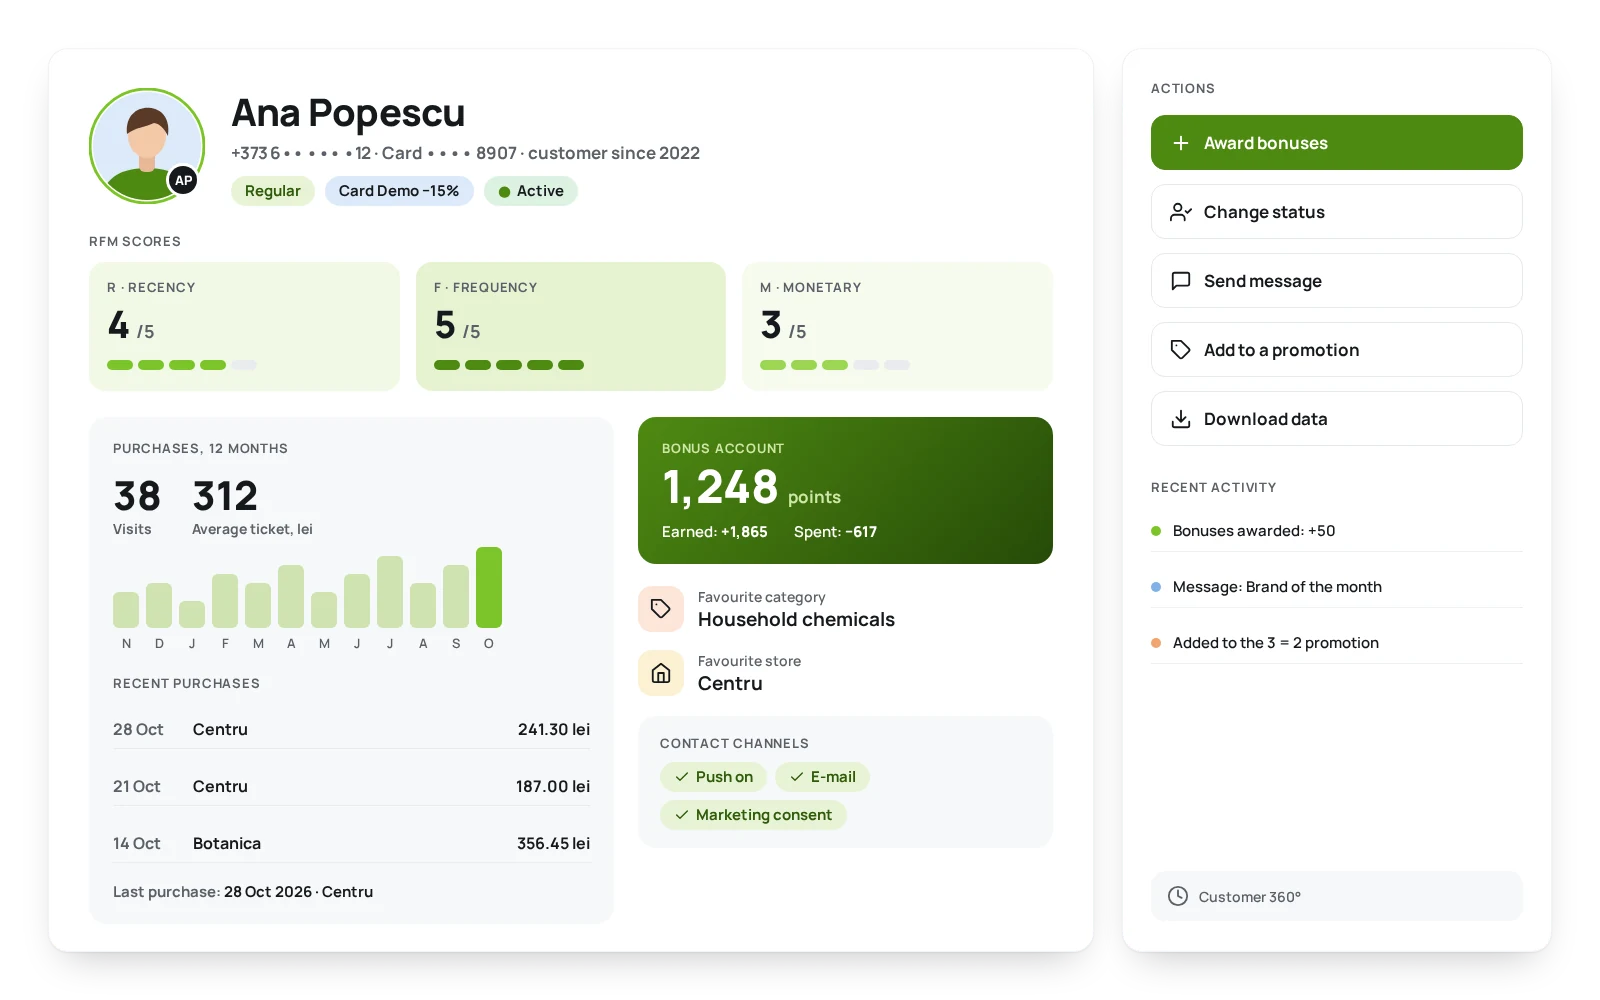
Each customer keeps the reason for the segment in words, plus the history of transitions.
The calculation runs per pair "customer and chain": in one chain a customer can be regular, in another lost.
Conditions are checked from top to bottom, and the first match wins. Special cases go first, then the rhythm.
No visits, a return after leaving, a single visit. This is where "Dormant", "Reactivated", "New" and "One-time buyer" are decided.
More than 365 days without a purchase: "Lost". Fewer than three visits a year: "Developing".
First the irregularity of intervals is checked, then the deviation from the rhythm: above 1.5 is "At risk", above 2.5 "Leaving", above 4 "Lost".
A yearly total in the top 20% of the chain: "Loyal", otherwise "Regular".
All thresholds (30 days for new, 1.5 / 2.5 / 4 for alarm, leaving and loss, 365 days and others) are defaults and can be configured for each trading chain.
RFM gives scores from 1 to 5 for recency, frequency and amount, by the chain's quintiles. ABC shows the customer's share of revenue (limits 80% and 95%), and XYZ shows purchase stability (limits 10% and 25%). A separate report shows who moved up or down in value since last year.
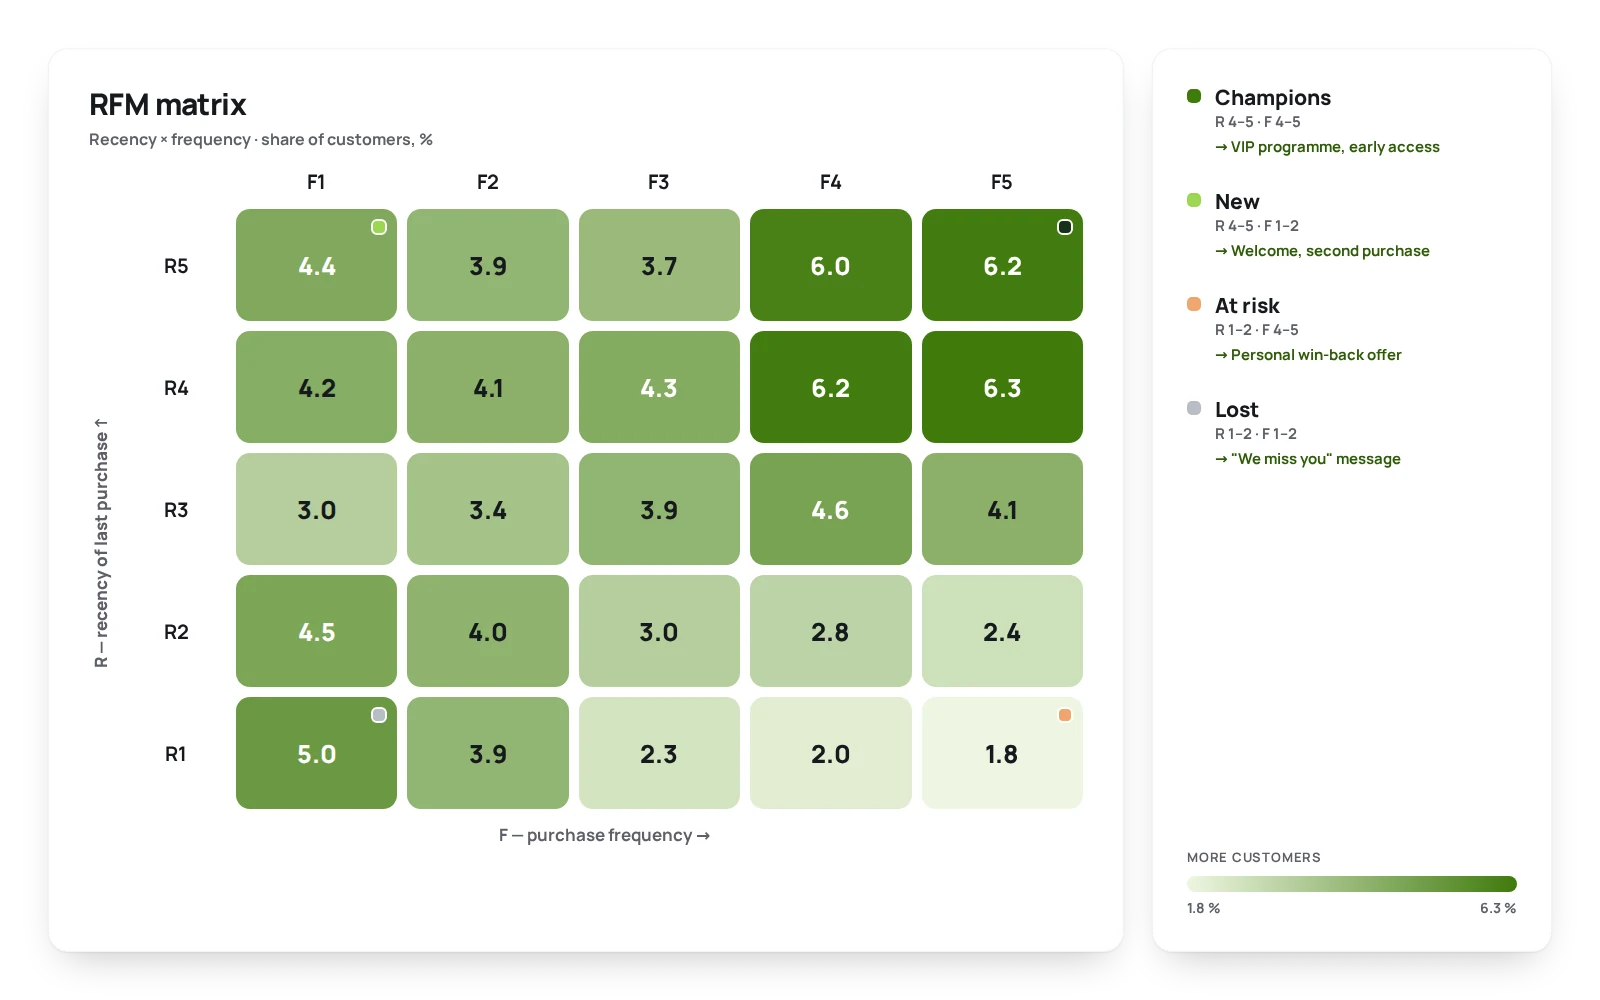
The metric groups: history and rhythm, money and value, basket and categories, windows and trends. Any metric can be recalculated from the customer's receipts.
An honest word about the start: the reports on transitions, cohorts, response, offer effect, dynamics and ABC migration fill up as calculation history accumulates. In the first month they may be incomplete, and some segments, for example "Sleeping", may stay empty.
A segment change is an event that starts a rule: a reactivation campaign can be built without a programmer, with a message or bonuses. A segment also works as a condition in any discount rule.
A control group is built into the offer: a customer is assigned to a group by a hash of the identifier and always stays in it. The "Offer effect" report compares the offer with the control group.
Deactivating lost customers comes with safeguards: a customer is deactivated only if lost in all chains, preview is on by default, the job is switched off, and an unset term stops the process.
The threshold takes the customer's rhythm into account. Someone who shops once a quarter does not land in "Leaving" after a month's pause.
Yes, thresholds are configured for each trading chain.
No. Some reports show dynamics and fill up as calculation history accumulates.
Create a rule with a segment condition and the "segment change" event, add the message, and take the audience from the "Reactivation candidates" report.
A 30-minute conversation about your loyalty program, with no generic slides.