R: recency
How many days have passed since the last purchase. The fewer the days, the higher the score: a recent customer is closer to another purchase.
R, F and M explained with a store example: how scores are calculated, who sits in the corners of the matrix and what to do with each group. The method is simple, but it has limits.
RFM analysis splits customers by three questions: how recently they bought (Recency), how often they buy (Frequency) and how much they spend (Monetary). It is one of the easiest forms of RFM segmentation to understand, and to start you only need receipts linked to a customer: the date, the amount and the card number.
How many days have passed since the last purchase. The fewer the days, the higher the score: a recent customer is closer to another purchase.
How many times the customer bought in the chosen period. Usually visits are counted, meaning days with purchases: two receipts on one day make one visit.
How much the customer spent in the same period. You can take the total or the average receipt, but the same way for every customer.
Each indicator is turned into a score from 1 to 5. Usually customers are ranked and divided into five equal groups, quintiles: the strongest 20% get 5, the next 20% get 4, and so on down to 1. For recency the order is reversed: the most recent fifth gets 5.
This way the score shows a customer's position within your chain, not on an absolute scale. You do not have to invent thresholds: they come from your own receipts.
All figures below are an example, not data from any store. Suppose we look at one year and compare three customers.
| Customer (example) | Last purchase | Visits in a year | Total for the year | R | F | M |
|---|---|---|---|---|---|---|
| Anna | 5 days ago | 24 | 9,000 lei | 5 | 5 | 5 |
| Victor | 40 days ago | 6 | 2,500 lei | 3 | 3 | 3 |
| Igor | 200 days ago | 2 | 1,200 lei | 1 | 1 | 2 |
Scores are often written as three digits. Anna came out as 555, Victor as 333, Igor as 112. These codes are convenient to merge into groups.
Look at Victor: he is neither leaving nor loyal, he is in the middle. Customers like him often have the biggest potential, because a small nudge (a reminder, a second purchase with a discount on a favorite category) can be enough to move him up. For Igor, on the other hand, an expensive offer probably will not help: first check whether he is just a one-off buyer.
There are 125 possible combinations (5 × 5 × 5), and nobody will work with each one separately. They are gathered into a few understandable groups:
| Group | Approximate scores | What kind of customer | What to do |
|---|---|---|---|
| Champions | High R, F, M | Bought recently, buys often, spends a lot | Look after them, thank them, do not waste extra discounts |
| Rising | High R, medium F | Recent, but not yet used to the store | Suggest a second and third purchase |
| Sleeping valuable | Low R, high F and M | Used to be a good customer, has not come for a long time | Personal message, an offer to return |
| New | High R, low F | Came recently, one purchase | A welcome offer |
| Lost | Low R, F, M | Left long ago, bought little | Cheap channels, no discounts |
The group names are conventional, so call them whatever you like. What matters is that every group has an action.
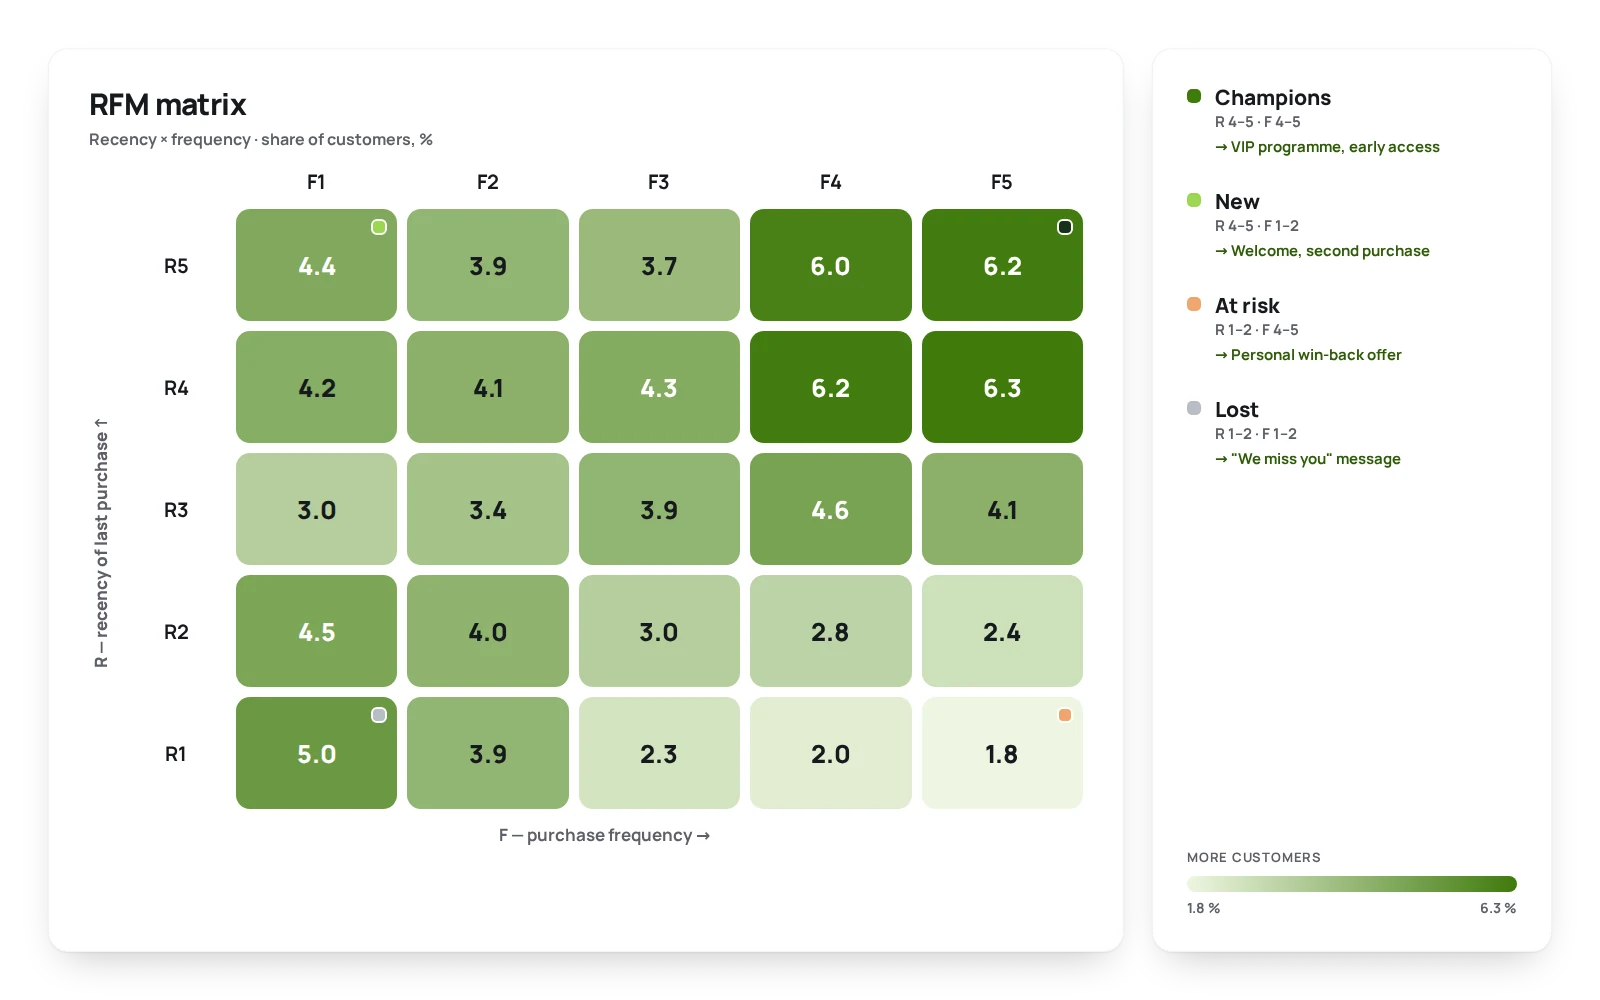
You need receipts linked to a customer. If the card is not shown at every purchase, the picture will be incomplete, and you should keep that in mind.
For groceries a short window fits; for rare purchases, a year or more.
No more than five or six groups and one action for each.
Leave part of the customers untouched and compare who came back.
RFM describes past behavior. It does not predict what a customer will do tomorrow; it only helps you decide whom to talk to first.
RFM is convenient but not universal: - One rule for everyone. A customer who comes weekly and one who buys once a quarter get the same R for the same pause, although a 40-day pause is normal for the second and alarming for the first. - No causes. The score says who the customer is, not why. - Depends on the chain. Quintiles are calculated inside your own base: in different chains the same scores mean different things. - Little data. For new customers F and M show nothing yet, and one random large receipt lifts M higher than the customer deserves.
That is why RFM is often complemented by analysis of the customer's own rhythm: the pause is compared not with a common threshold but with how often that person usually buys. This is the subject of the article on lifecycle segments.
In the loyalty module inside the ERP system, the RFM matrix is calculated automatically: R, F and M scores from 1 to 5 by the chain's quintiles. In the customer profile, which gathers 60 indicators, they sit next to the lifecycle segment, so one card answers both "who is this" and "what do we do". More on the lifecycle page and in the description of the ERP module. You can see the matrix on your own data at a demo.
The method works with a base of any size, but it is more reliable with a few hundred customers who have purchase history. On a very small base the quintiles come out coarse.
RFM rates recency, frequency and money on a common scale for the chain. Lifecycle segments compare a customer's pause with that customer's own rhythm and show who is leaving.
Once a month is enough. For actions by group, regularity matters more than day-level accuracy.
You need to identify the customer on the receipt. A card, a phone number or an app provides that; without it the analysis is impossible.
A discount and a bonus look alike, but they affect margin, purchase frequency and the cashier's work differently. We compare them on one receipt and give a rule for choosing.
Read more →A step-by-step launch plan: from the goal and mechanics to cashier training and first measurements. No promised timelines: they depend on your chain.
Read more →New, loyal, at risk, lost, reactivated: what each segment means, how the threshold is set and which action follows.
Read more →A 30-minute conversation about your loyalty program, with no generic slides.