New and one-time buyers
There is one task: the second purchase. It is the main growth reserve, because after the first visit the customer decides whether coming back is worth it.
New, loyal, at risk, lost, reactivated: what each segment means, how the threshold is set and which action follows.
Customer lifecycle segments answer a question that an ordinary sales report cannot: which buyers are getting closer right now and which are drifting away. Good customer segmentation in retail helps you notice customers who are leaving in time, while winning them back is still cheap.
The simplest way to find lost customers is "has not bought for 90 days". It works badly. Someone who drops in for bread every three days has vanished after two weeks. Someone who buys appliances twice a year has vanished only after a year. A common threshold either notices the first group too late or alarms you for nothing about the second.
That is why the pause must be compared with the customer's own rhythm: how often that person usually buys. For this you calculate: - a visit as a day with purchases (two receipts on one day make one visit); - the customer's usual interval between visits; - the deviation from rhythm: the current pause divided by the usual interval.
An example (illustrative): a customer usually comes once a week and has not been for 21 days. The deviation is three. For a customer with a 90-day rhythm, the same 21-day pause means a deviation below one, so all is well.
Segments are defined by rules checked from top to bottom; the first match wins. This way a customer cannot land in two segments at once, and the reason for each decision can be recorded in words.
These are the main rungs. The thresholds (30 days, 1.5, 2.5, 4) are settings, chosen for the chain and the type of goods. For groceries they are one thing, for furniture something else entirely.
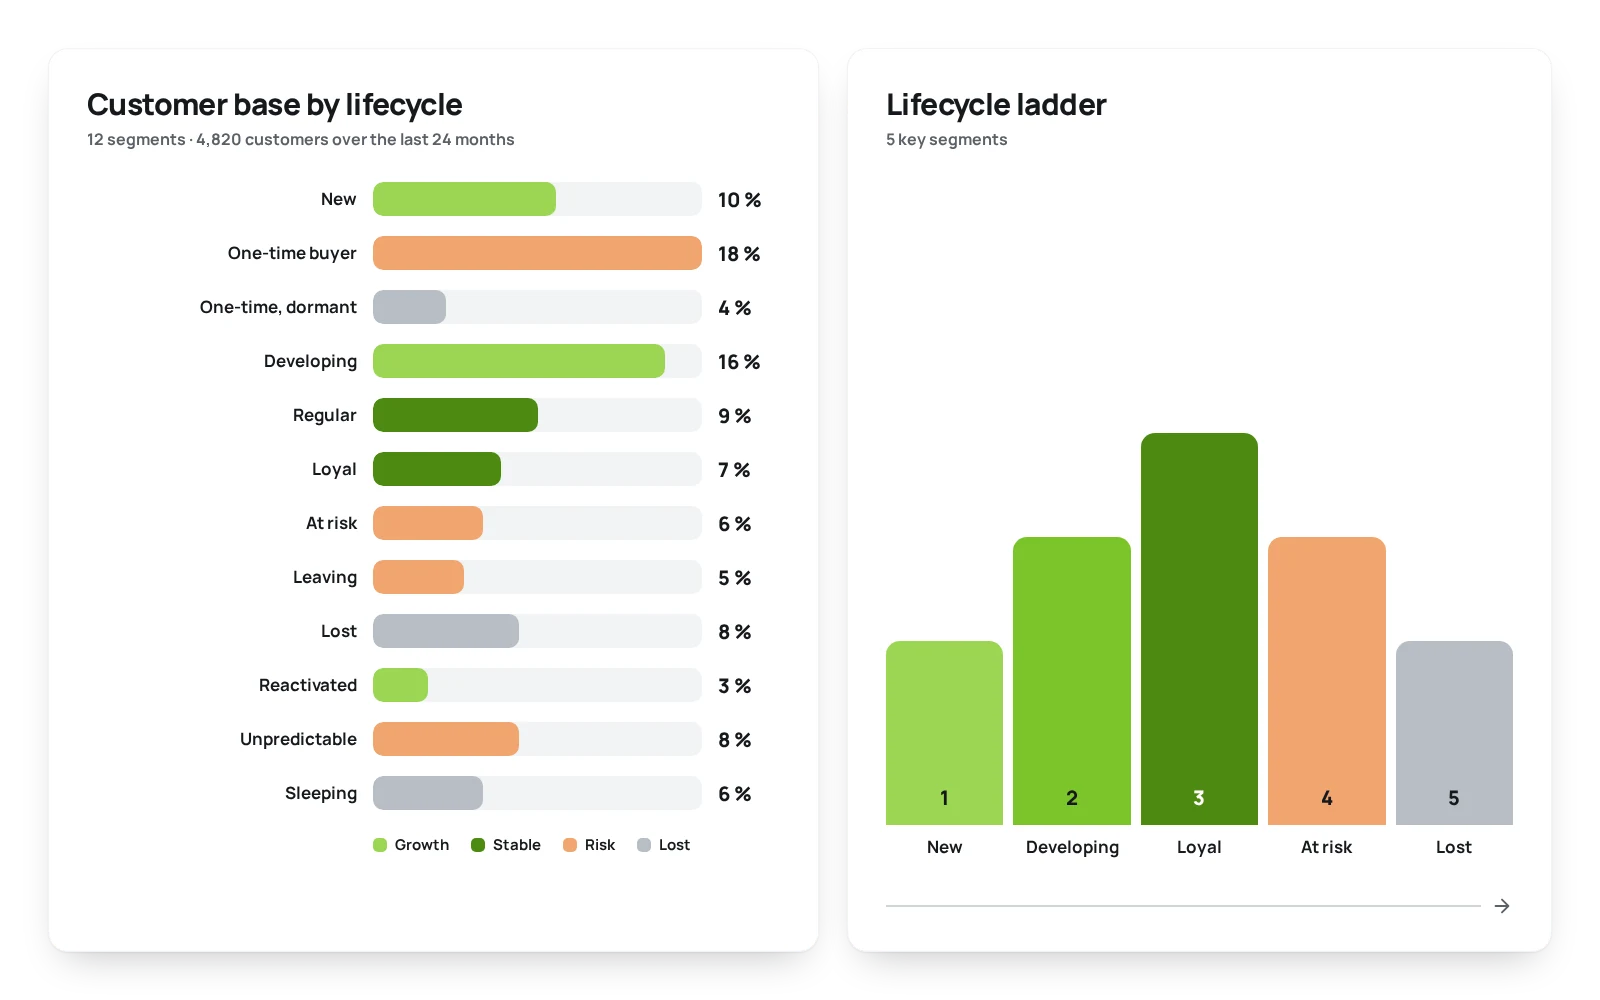
A good system does not just stick on a label; it explains it in words, for example "pause 2.9 times longer than usual, leaving threshold 2.5". This matters for two reasons. The marketer can check a decision on a single customer and make sure the threshold is sensible. And if a segment looks odd, you can see which rule fired and correct it.
The main principle: the action depends on the segment, it is not one action for everyone.
There is one task: the second purchase. It is the main growth reserve, because after the first visit the customer decides whether coming back is worth it.
They do not need a discount just for buying anyway. They need attention, status, early access to offers and a higher average receipt.
Speed and gentleness matter here. First a reminder or a useful message, and only then an offer.
The strongest offer, but in cheap channels and always with measurement: did the people we contacted come back?
Estimate how often your customer usually buys: weekly, monthly or less often. All the other thresholds depend on it.
For example, an alert at a pause one and a half times longer than usual, leaving at two and a half. This is a starting point, not the truth.
If almost everyone landed in "leaving", the thresholds are too strict. If nobody did, they are too soft.
The assortment and habits change, so thresholds need rechecking.
Do not send strong offers to everyone "lost" in bulk. First separate those who really left from those who simply buy rarely.
The loyalty module inside the ERP system calculates 12 lifecycle segments, keeps the reason for each customer's segment, and a segment change can trigger a rule: for example, a light message when a customer moves to "at risk". 60 indicators are available for each customer, and the reports include a list of reactivation candidates and a comparison of an offer with a control group. Details are on the lifecycle page and in the description of the ERP module. A related method is described in the article on RFM. Want to see segments on your own data? Request a demo.
You need a history of receipts linked to customers. The more visits a customer has, the more precise the rhythm. For customers with one or two visits, simple rules are used instead of rhythm.
You can, but you will waste offers. A message to everyone annoys the loyal and does not persuade the lost.
RFM rates recency, frequency and money on a common scale for the chain. Lifecycle segments compare a customer's pause with that customer's own rhythm and show who is leaving.
Not necessarily. Keeping data longer than needed is a separate data protection question, which is worth discussing with a lawyer.
A discount and a bonus look alike, but they affect margin, purchase frequency and the cashier's work differently. We compare them on one receipt and give a rule for choosing.
Read more →A step-by-step launch plan: from the goal and mechanics to cashier training and first measurements. No promised timelines: they depend on your chain.
Read more →R, F and M explained with a store example: how scores are calculated, who sits in the corners of the matrix and what to do with each group. The method is simple, but it has limits.
Read more →A 30-minute conversation about your loyalty program, with no generic slides.